Metrics
Overview
The /v1/metrics endpoint provides Prometheus-compatible metrics.
To use this feature, set an API token, include metrics in http-api-endpoints, and map container port 8080.
Enable multiple endpoints in one allowlist (for example
metrics,update) via http-api-endpoints.Enabling the metrics API with port mappings will automatically disable Watchtower’s self-update functionality to prevent port conflicts during container recreation.
See Updating Watchtower for more details.
The
/v1/metrics endpoint only accepts GET requests.
Requests with other HTTP methods will receive a 405 Method Not Allowed response.Available Metrics
| Name | Type | Description |
|---|---|---|
watchtower_containers_scanned | Gauge | Number of containers scanned for changes during the last scan |
watchtower_containers_updated | Gauge | Number of containers updated during the last scan |
watchtower_containers_failed | Gauge | Number of containers where update failed during the last scan |
watchtower_containers_restarted_total | Counter | Number of containers restarted due to linked dependencies since watchtower started |
watchtower_containers_skipped | Gauge | Number of containers skipped during the last scan |
watchtower_scans_total | Counter | Number of scans since watchtower started |
watchtower_scans_skipped_total | Counter | Number of skipped scans since watchtower started |
watchtower_docker_images_bytes | Gauge | Docker image storage usage in bytes from the last disk-space check |
watchtower_docker_images_reclaimable_bytes | Gauge | Reclaimable Docker image storage in bytes from the last disk-space check |
watchtower_disk_space_max_bytes | Gauge | Configured Docker image-usage maximum in bytes (0 if unset) |
watchtower_disk_space_warn_bytes | Gauge | Configured Docker image-usage warning threshold in bytes (0 if unset) |
The four image-usage gauges are updated when disk-space-max or disk-space-warn are set.
See Disk Usage Monitor.
Example Prometheus scrape_config
scrape_configs:
  - job_name: watchtower
    scrape_interval: 15s
    metrics_path: /v1/metrics
    bearer_token: demotoken
    static_configs:
      - targets:
        - 'watchtower:8080'
Replace demotoken with the Bearer token you have set accordingly.
Demo
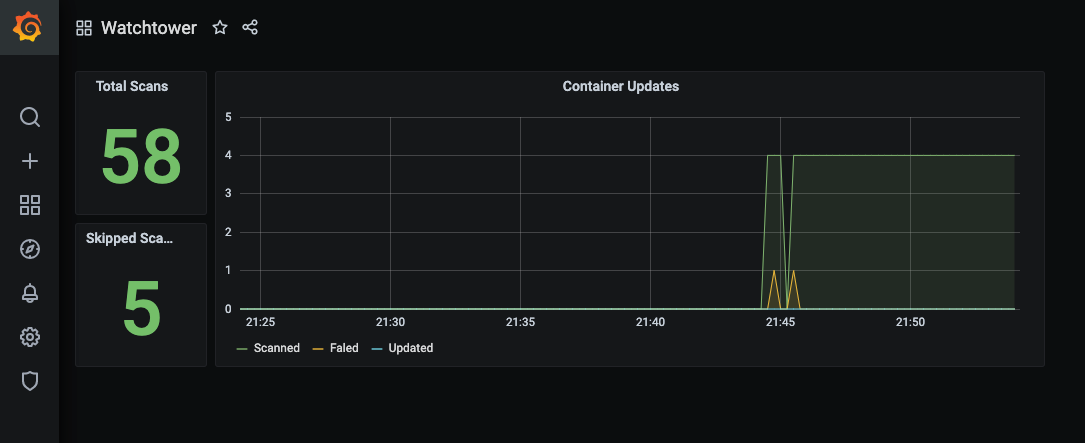
The repository contains an example deployment with Prometheus and Grafana, available through /examples/metrics/docker-compose.yml.
This demo is preconfigured with a dashboard, which will look something like this:
Last updated on